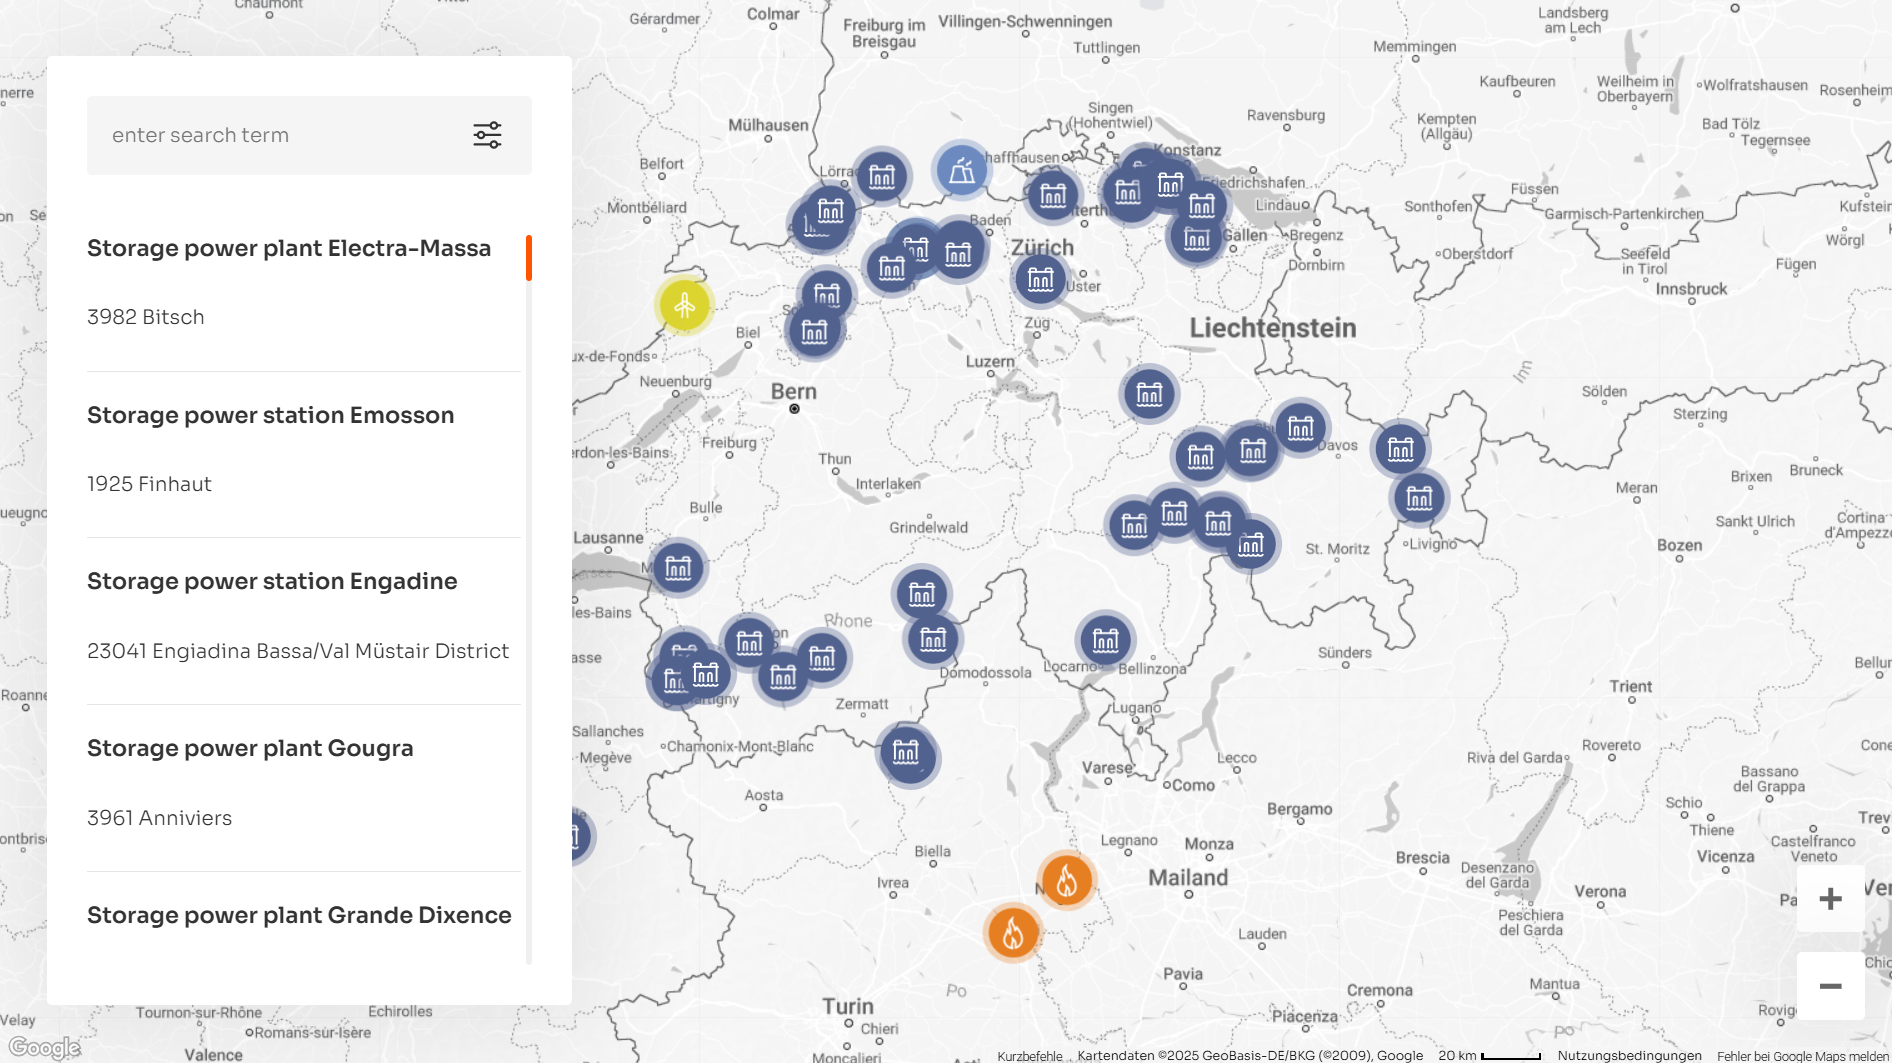
All our assets at a glance
Consent required
In order to show you the content of Google Maps, you must consent to the use of third-party cookies (e.g. Google).
Please note that by giving consent, personal data will be transmitted to third parties. You can adjust your consent at any time.
Power Production in 2025
Power plants | Installed capacity at 31.12.20251 | Production 20252 |
| Hydropower (total) | 3,199 | 7,001 |
| Switzerland | 3,049 | 4,704 |
| France3 | 150 | 1,941 |
| Small-scale hydropower, wind, photovoltaics (total) | 244 | 323 |
| Switzerland | 7 | 13 |
| France | 13 | 33 |
| Italy | 224 | 277 |
| Nuclear power (total) | 831 | 4,546 |
| Switzerland | 676 | 3,631 |
| France4 | 155 | 915 |
| Conventional thermal power (total) | 1,343 | 2,990 |
| Italy | 526 | 2,401 |
| Spain | 414 | 327 |
| Hungary | 403 | 262 |
Total | 5,616 | 14,860 |
1 Based on Alpiq’s net share of total power plant production
2 Alpiq share of total power plant production
3 Including base versus peak exchange contract
4 Long term supply contract
Source: Annual Report 2025