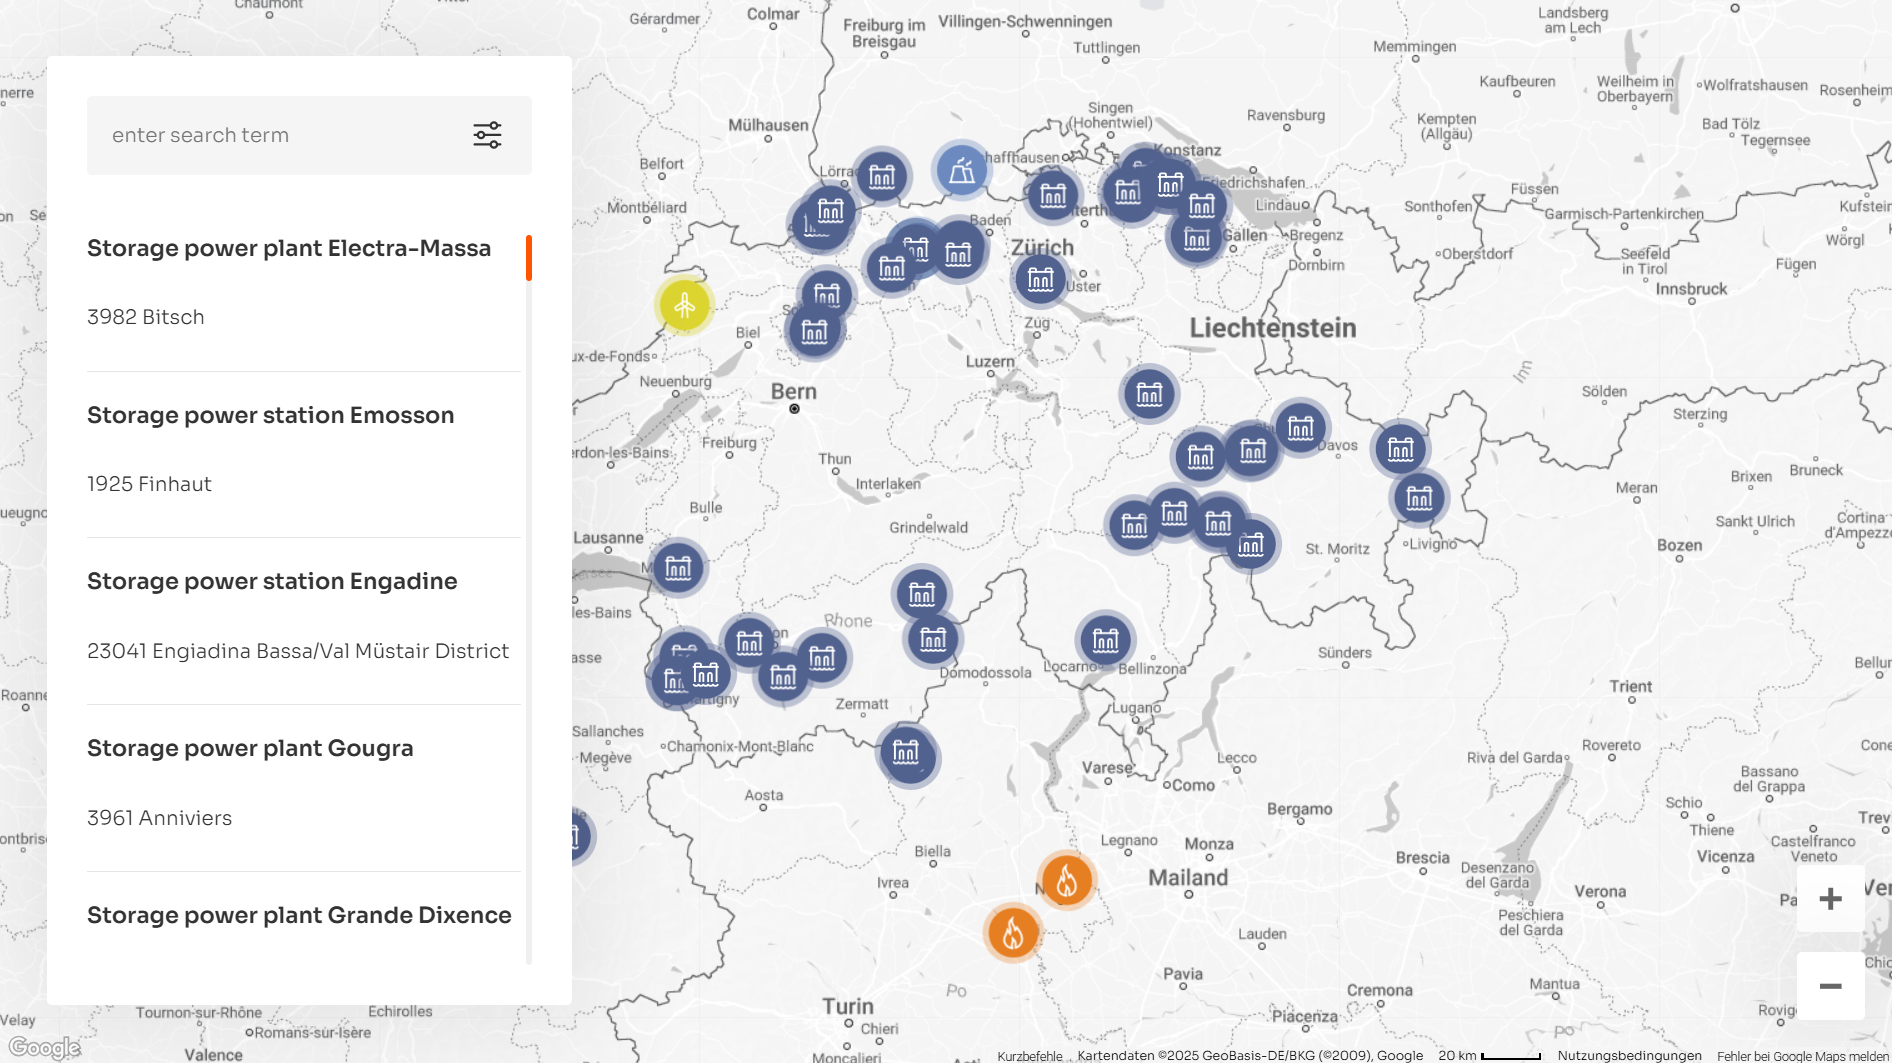
Tous nos aménagements en un coup d'œil
Autorisation requise
Afin de pouvoir vous présenter le contenu de Google Maps, vous devez consentir à l'utilisation de cookies de tiers (par exemple Google).
Veuillez noter qu'en donnant votre accord, des données personnelles seront transmises à des tiers. Vous pouvez modifier votre consentement à tout moment.
Power Production in 2025
Power plants | Installed capacity at 31.12.20251 | Production 20252 |
| Hydropower (total) | 3,199 | 7,001 |
| Switzerland | 3,049 | 4,704 |
| France3 | 150 | 1,941 |
| Small-scale hydropower, wind, photovoltaics (total) | 244 | 323 |
| Switzerland | 7 | 13 |
| France | 13 | 33 |
| Italy | 224 | 277 |
| Nuclear power (total) | 831 | 4,546 |
| Switzerland | 676 | 3,631 |
| France4 | 155 | 915 |
| Conventional thermal power (total) | 1,343 | 2,990 |
| Italy | 526 | 2,401 |
| Spain | 414 | 327 |
| Hungary | 403 | 262 |
Total | 5,616 | 14,860 |
1 Based on Alpiq’s net share of total power plant production
2 Alpiq share of total power plant production
3 Including base versus peak exchange contract
4 Long term supply contract
Source: Annual Report 2025