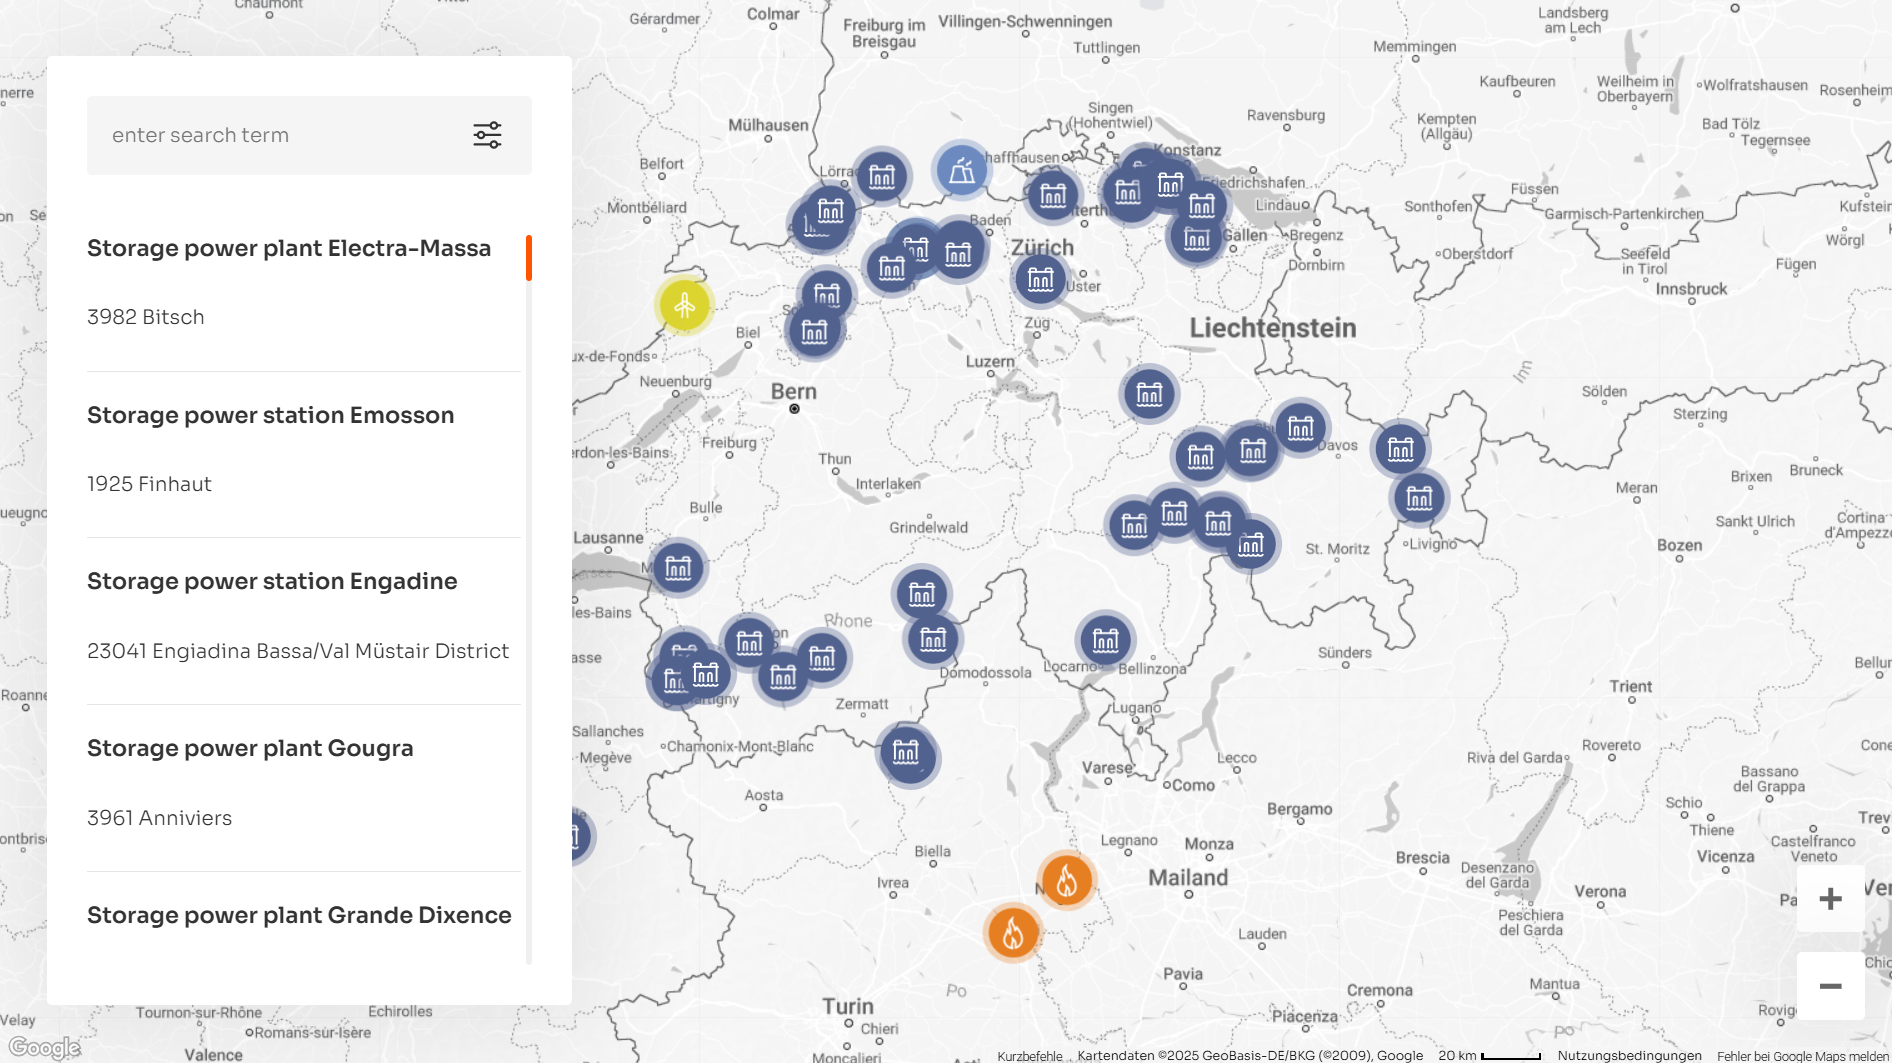
Tous nos aménagements en un coup d'œil
Autorisation requise
Afin de pouvoir vous présenter le contenu de Google Maps, vous devez consentir à l'utilisation de cookies de tiers (par exemple Google).
Veuillez noter qu'en donnant votre accord, des données personnelles seront transmises à des tiers. Vous pouvez modifier votre consentement à tout moment.

Power Production in 2024
Power plants | Installed capacity at 31.12.20241 | Production 20242 |
| Hydropower (total) | 3,327 | 6,774 |
| Switzerland | 3,027 | 5,692 |
| France3 | 300 | 1,082 |
| Small-scale hydropower, wind, photovoltaics (total) | 255 | 427 |
| Switzerland | 18 | 70 |
| France | 13 | 38 |
| Italy | 224 | 319 |
| Nuclear power (total) | 831 | 6,705 |
| Switzerland | 676 | 5,833 |
| France4 | 155 | 873 |
| Conventional thermal power (total) | 1,308 | 3,375 |
| Italy | 491 | 2,444 |
| Spain | 414 | 487 |
| Hungary | 403 | 444 |
Total | 5,721 | 17,281 |
1 Based on Alpiq’s net share of total power plant production
2 Net share attributable to Alpiq from total power plant production (after deducting pumped energy)
3 Including base versus peak exchange contract
4 Long term supply contract
Source: Annual Report 2024